Graphics Library – 60,000 Images Sorted by Topic
If you like to write your own questions, then you will love Problem-Attic’s graphics library. It’s a source of more than 60,000 images for all grades and core subjects: math, science, social studies and ELA.
Briefly, in addition to building a database of questions, we’ve pulled out all of their images, organized them by topic, and made them easy to select and re-use. You’ll find everything from science diagrams and geometry figures to maps, newspaper headlines, and political cartoons—excellent stimulus for new questions.
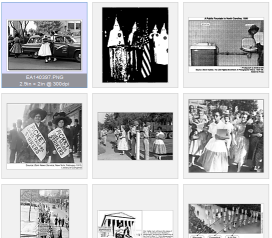
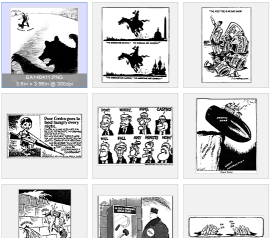
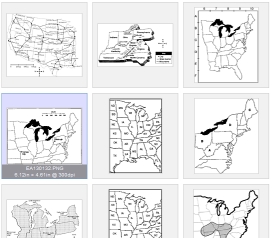
The following screenshots will give you an idea of how the graphics are organized and what’s available. They show just six out of nearly 60 topics for social studies.
 |
 |
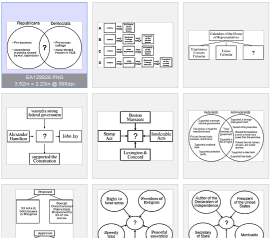 |
| Photos - Civil Rights | Political Cartoons - Cold War | Graphic Organizers - Government | 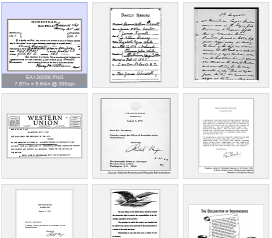 |
 |
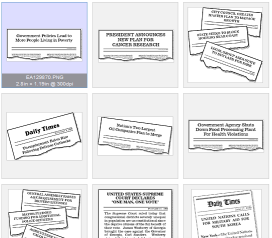 |
| Historical Documents | Miscellaneous Maps | Newspaper Headlines |
Note: The graphics library is a subscriber option. You can try it in the Play Area, which has a small subset of the graphics. To learn more about a school-wide subscription to Problem-Attic, click here.
How to Use the Graphics Library
To make use of the graphics library, you first need to launch the Problem Editor. You can do this for an existing problem on the Select or Arrange pages, or for a new problem that you write. Here are the steps for a new problem.
-
Click the Arrange tab.
-
Click the Write New Problem button.
-
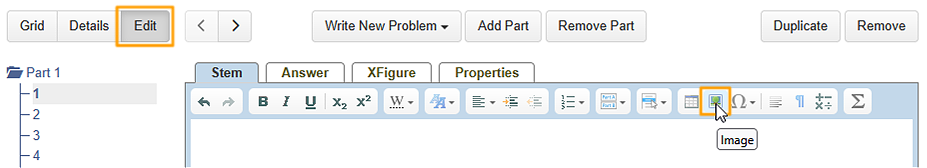
You can start by writing the problem stem, or by inserting an image, whatever you prefer. If you do write something, put the cursor where you’d like the image to appear.
-
Click the Insert Image icon in the Editor toolbar.
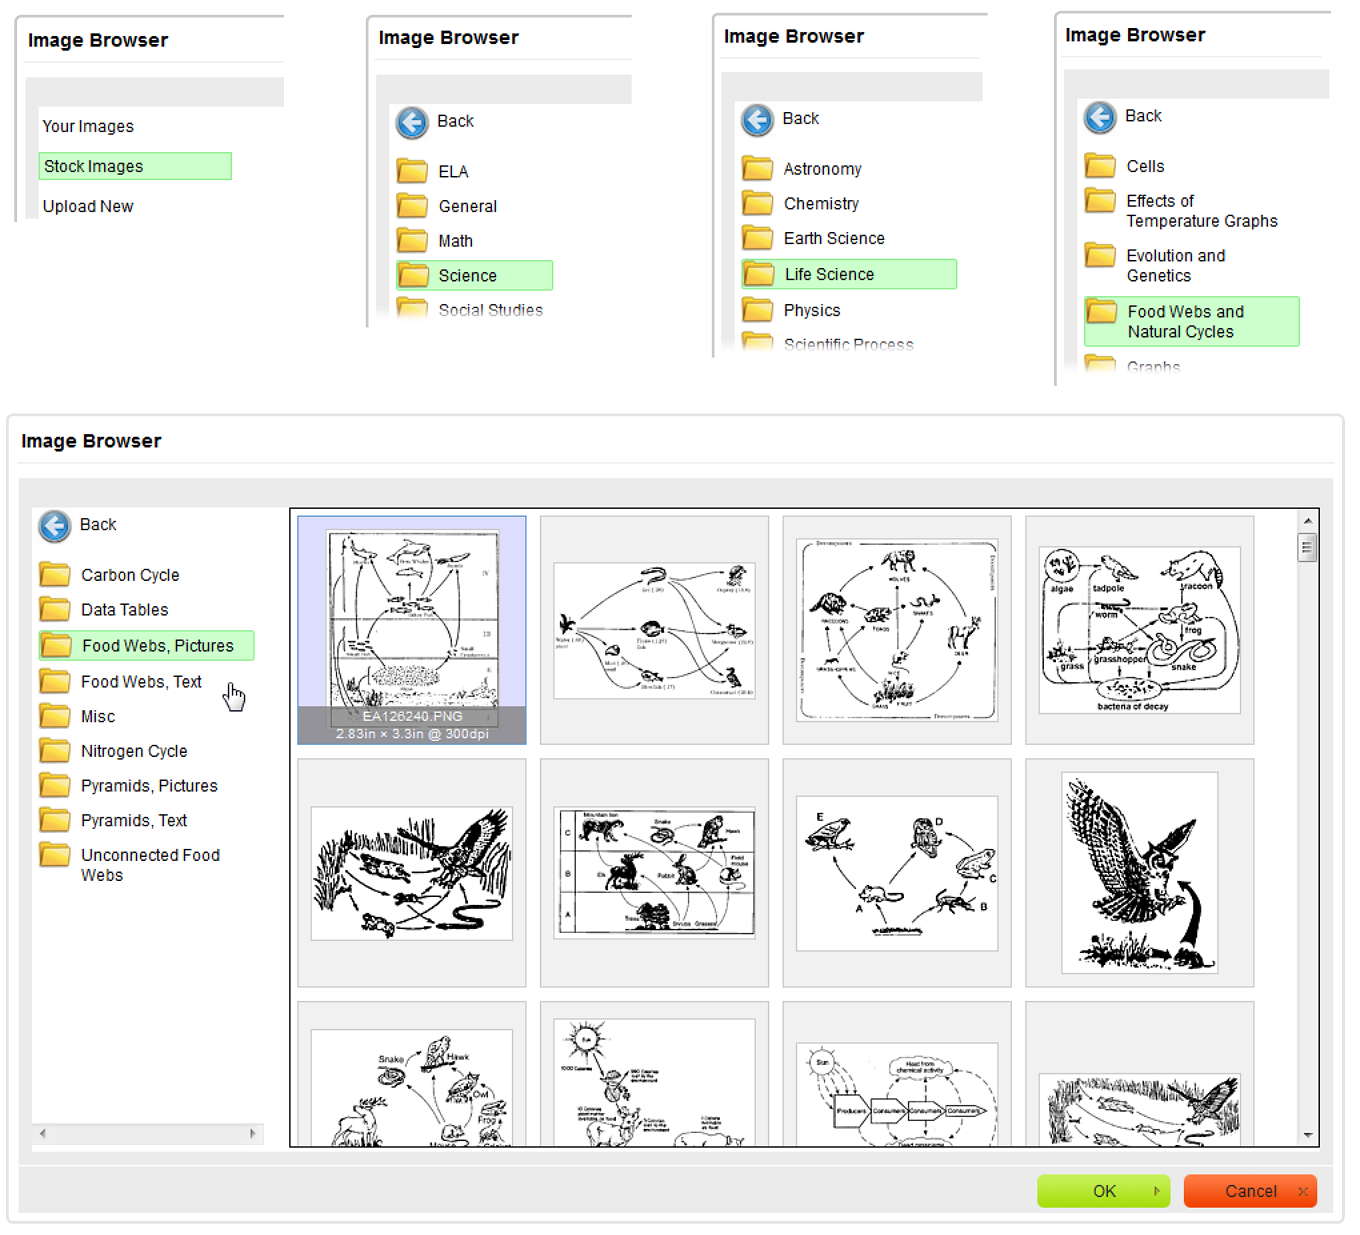
-
In the image browser, click Stock Images.
-
Drill down through the topics until you see images on the right. Select an image that you like, then click OK.
-
The image will get inserted into your problem. You can resize it by right-clicking and choosing Image Properties from the pop-up menu.
-
Repeat steps 4–7 if you want to insert any other images, say for a multiple-choice problem. When you are done, click the Save button in the Editor.
The XFigure tab in the Editor
The XFigure tab gives you a alternative way of associating an image with a problem. Unlike the method above, where you insert an image exactly where you want it to go, what we call an “xfigure” is allowed to float around a problem, to help make page layout more efficient. For example, if the image fits to the right of a multiple choice block, Problem-Attic will put it there; otherwise, it will go between the stem and the choices.
An xfigure has two other qualities that you may want to take advantage of:
-
If a series of problems all have the same xfigure, it will show up only once in a PDF, for the first problem in the series. This allows you to write multiple problems with the same xfigure and not be concerned about which of the problems will be selected or in what order.
-
You can include conditional text with an xfigure. This allows you to subtly change the wording of a problem depending on whether the xfigure is shown (in the first problem in a series) or hidden. For example, for the text which is labeled “if shown”, you could say “Look at the figure below.” For the text labeled “if hidden”, you could say “Refer to the figure in the previous problem.” The conditional text appears in a separate paragraph above the stem.
For problem stimulus, the XFigure tab is especially handy. You can take advantage of the non-repeating behavior and conditional text even if you don’t want the xfigure to float around the problem. If you want the xfigure always to be at the beginning of a problem, or to the right or below, use the option labeled “Position”.
To use the Graphics Library with the XFigure tab, simply click the Browse button and select one of the stock images.